In today’s fast-paced world of software development, efficiency is key. As developers, we constantly strive to write code that not only works but performs optimally. However, knowing if our code is running efficiently requires more than just intuition — it requires precise measurement and analysis.
In this post, we’ll explore the importance of measuring code speed and performance in .NET applications. We’ll explore various tools and techniques that can help you gain insights into your code’s execution time, identify bottlenecks, and ultimately, optimize your application’s performance. Whether you’re a seasoned .NET developer or just starting, understanding how to measure and improve code speed is essential for building high-performance applications.
💻Benchmarking with Stopwatch
The simplest way to measure the speed of a piece of code is using the Stopwatch class in the System.Diagnostics namespace. Here’s how you can use it:
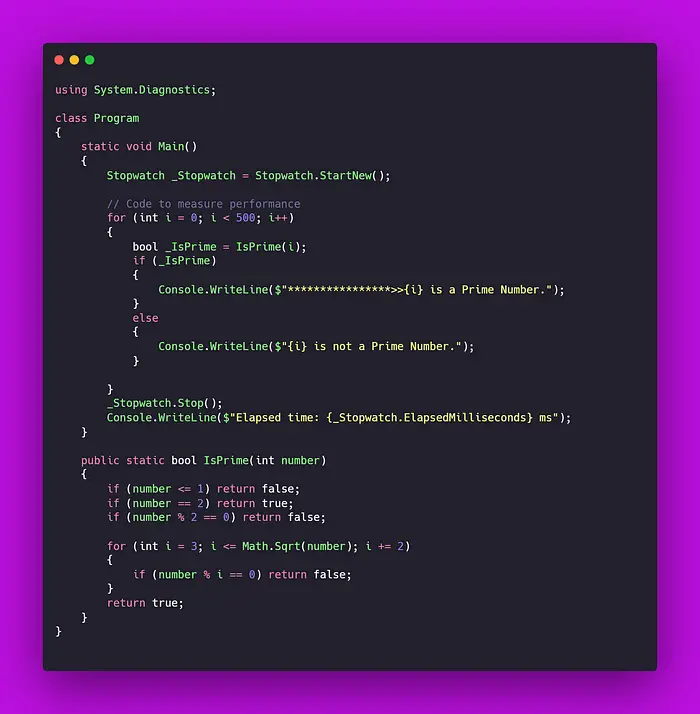
using System.Diagnostics;
class Program
{
static void Main()
{
Stopwatch _Stopwatch = Stopwatch.StartNew();
// Code to measure performance
for (int i = 0; i < 500; i++)
{
bool _IsPrime = IsPrime(i);
if (_IsPrime)
{
Console.WriteLine($"****************>>{i} is a Prime Number.");
}
else
{
Console.WriteLine($"{i} is not a Prime Number.");
}
}
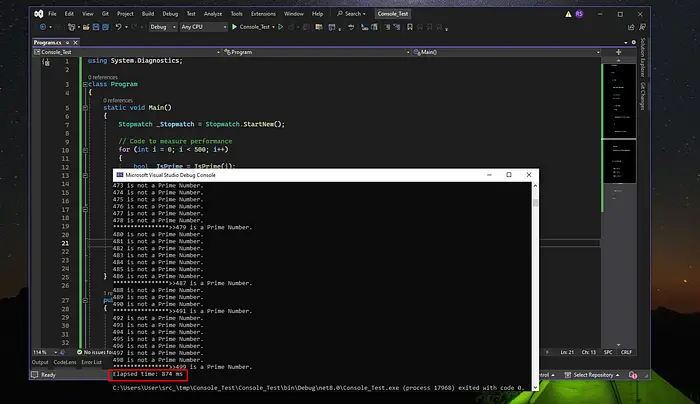
_Stopwatch.Stop();
Console.WriteLine($"Elapsed time: {_Stopwatch.ElapsedMilliseconds} ms");
}
public static bool IsPrime(int number)
{
if (number <= 1) return false;
if (number == 2) return true;
if (number % 2 == 0) return false;
for (int i = 3; i <= Math.Sqrt(number); i += 2)
{
if (number % i == 0) return false;
}
return true;
}
}
💻Profiling Tools
For more detailed analysis and profiling, consider using specialized tools like:
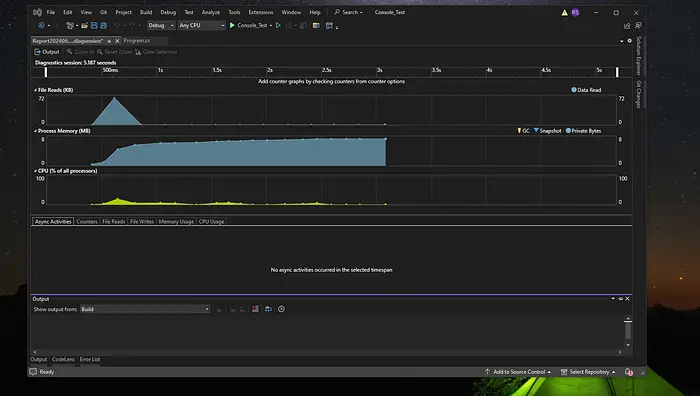
- Visual Studio Profiler: Integrated into Visual Studio, it provides detailed insights into CPU and memory usage, function timings, and more.
- dotTrace: A third-party profiler from JetBrains that offers comprehensive performance analysis.
- Windows Performance Toolkit: Includes tools like Xperf and WPR for in-depth performance profiling.
These tools can give you a breakdown of where your code spends most of its time, identifying bottlenecks and areas for optimization.
💻Benchmarking Libraries
For more advanced scenarios, consider using benchmarking libraries like:
- BenchmarkDotNet: A powerful library for benchmarking that automates many aspects of performance measurement and provides statistical analysis of results.
- NBench: A .NET performance benchmarking and testing framework.
These libraries are designed to handle complexities like warm-up phases, statistical analysis of results, and comparing different implementations.
✅Best Practices
- Isolate Code: Benchmark small, isolated pieces of code rather than entire applications to focus on specific performance improvements.
- Repeat Measurements: Average results from multiple runs to account for variations caused by external factors.
- Understand Overheads: Be aware of any overhead introduced by the measurement techniques themselves, especially when benchmarking very fast operations.
👏Conclusion
Measuring code speed is a critical aspect of developing high-performance .NET applications. By understanding the various tools and techniques available, you can pinpoint performance bottlenecks and make informed decisions to optimize your code. Throughout this blog, we explored the importance of performance measurement, examined essential tools like BenchmarkDotNet and dotTrace, and discussed best practices for effective benchmarking.
Remember, optimization is an ongoing process. Regularly profiling your applications and staying updated with the latest performance tips and tools will ensure that your .NET applications run smoothly and efficiently. By prioritizing performance from the outset and continually refining your code, you’ll deliver faster, more responsive software that delights your users.
Thank you for joining us on this journey to measure and improve code speed in .NET. We hope you found these insights valuable and are now better equipped to tackle performance challenges in your projects. Keep coding, keep optimizing, and let your applications soar!